Render LaTeX math expressions as native R grid graphics objects, with no external LaTeX installation required.
gridmicrotex embeds the MicroTeX C++ layout engine to parse LaTeX, compute the full box model, and produce resolution-independent vector output (paths, lines, rectangles) that works on any R graphics device.
Disclaimer
A note on development: This package was developed as a proof of concept for AI-assisted package creation. I designed the architecture and specification, and the core C++ integration (via MicroTeX) was largely facilitated by AI, with my review and oversight of the design and final outputs. I am sharing it because it works, and I hope that others will find it useful. Contributions, bug reports and improvements from the community are very welcome.
Installation
Install the development version from GitHub:
# install.packages("devtools")
devtools::install_github("adayim/gridmicrotex")
Examples
library(gridmicrotex)
library(grid)

grid.newpage()
grid.latex("x = \\frac{\\textcolor{red}{-b} \\pm \\sqrt{b^{2} - 4ac}}{2a}",
           gp = grid::gpar(fontsize = 30))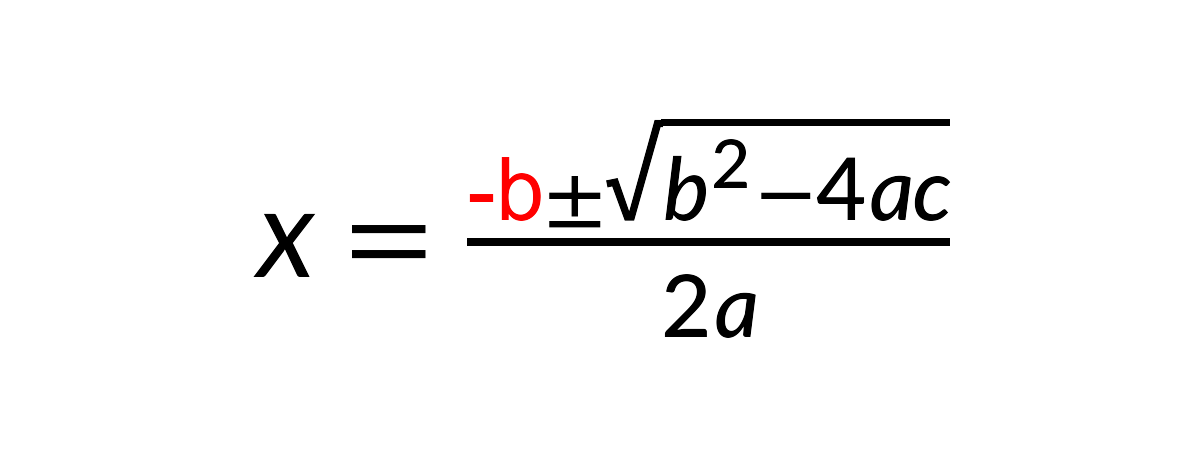
By default, the input is treated as LaTeX math mode (“mixed” mode), which wraps non-math text in \text{} and preserves math expressions as-is. Use $...$ or \\(...\\) delimiters to render math. The "x = " in the equation above treated as text. Use input_mode = "math" to treat the whole string as math mode and render text with \\text{}. You can change this with global option latex_options(input_mode = "math").
Composing with other grobs
The grob can be placed alongside other grid objects:
latex_options(input_mode = "math")
g <- latex_grob("\\frac{a}{b}", gp = grid::gpar(fontsize = 30))
grid.newpage()
# A blue box behind the formula
grid.rect(
  x = 0.5, y = 0.5,
  width = grobWidth(g) + unit(10, "bigpts"),
  height = grobHeight(g) + unit(10, "bigpts"),
  gp = gpar(fill = "#e8f0fe", col = "#4285f4", lwd = 2)
)

# The formula itself
grid.draw(g)
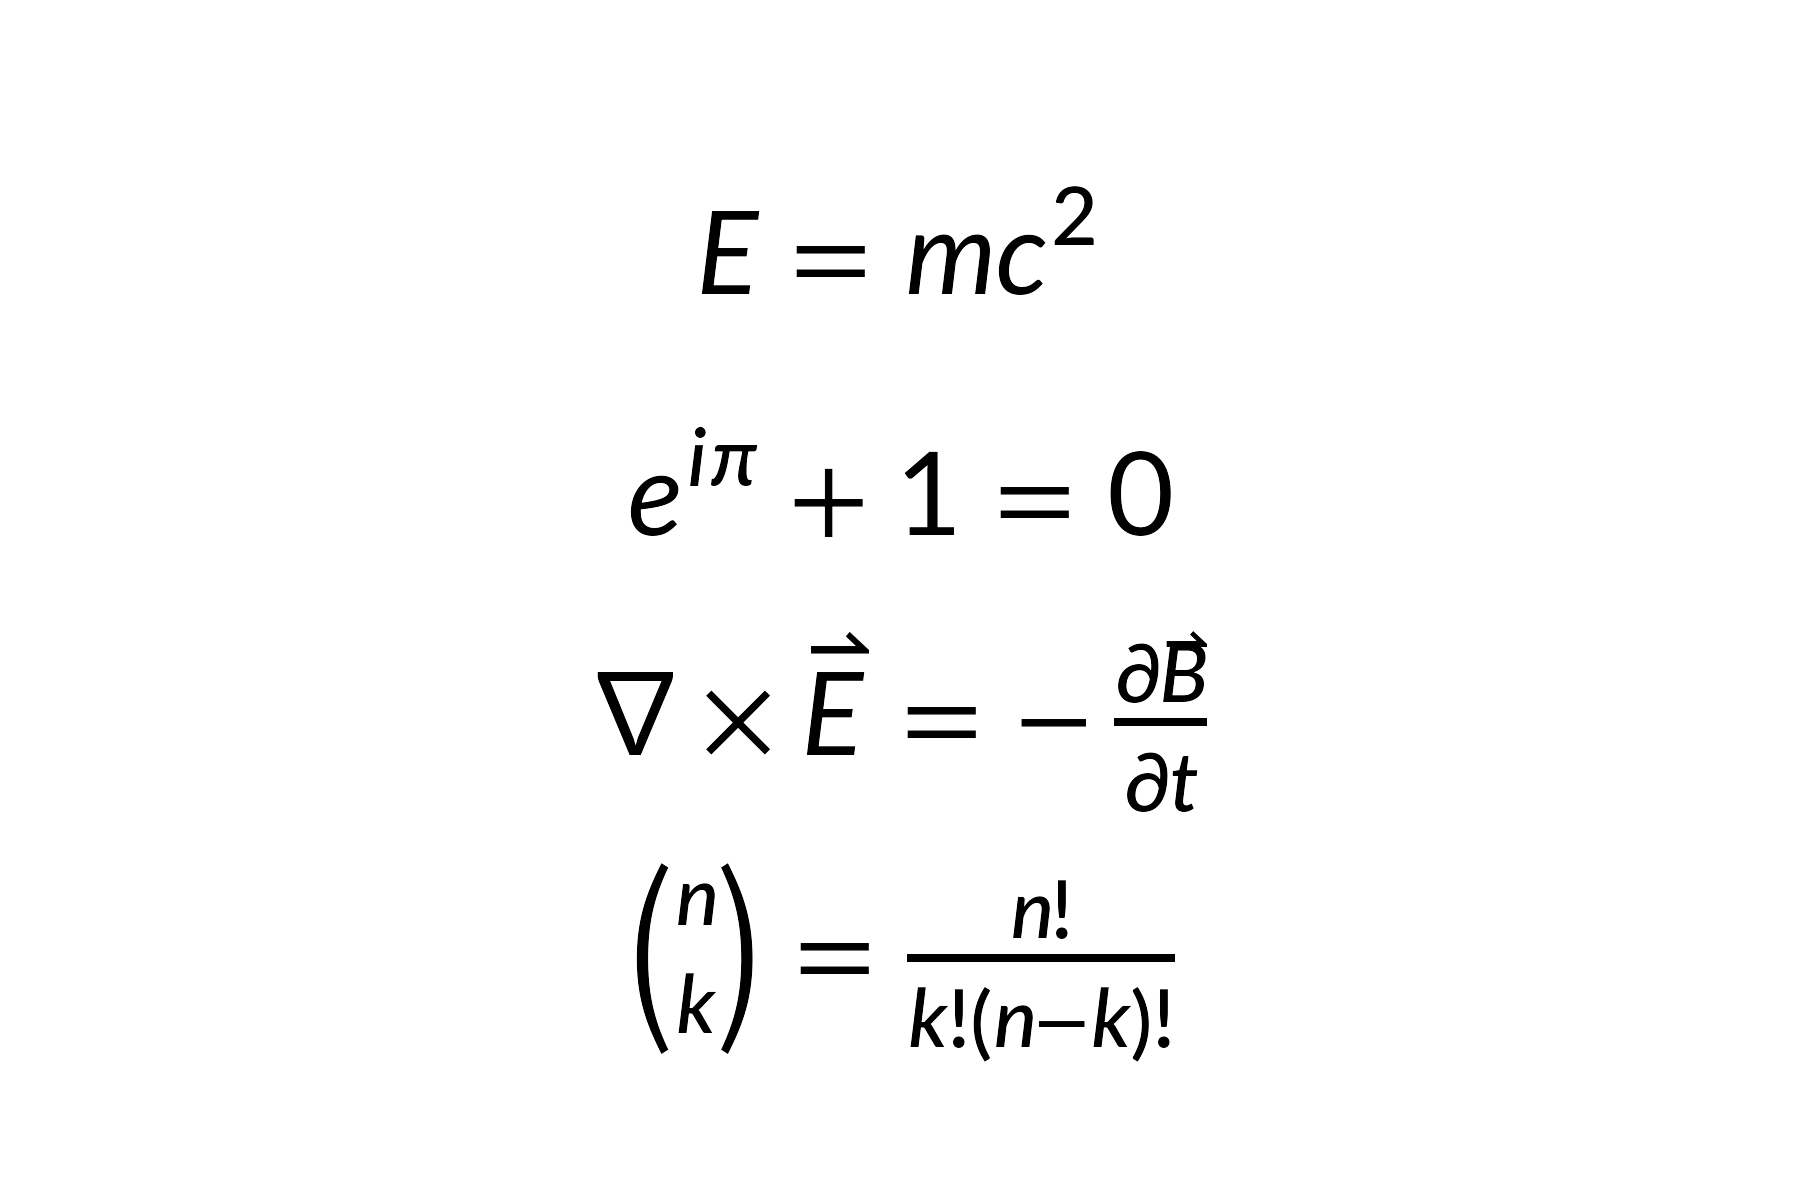
Multiple expressions
exprs <- c(
  "E = mc^{2}",
  "e^{i\\pi} + 1 = 0",
  "\\nabla \\times \\vec{E} = -\\frac{\\partial \\vec{B}}{\\partial t}",
  "\\binom{n}{k} = \\frac{n!}{k!(n-k)!}"
)

grid.newpage()
for (i in seq_along(exprs)) {
  grid.latex(
    exprs[i],
    x = unit(0.5, "npc"),
    y = unit(1 - i / (length(exprs) + 1), "npc"),
    gp = grid::gpar(fontsize = 28)
  )
}
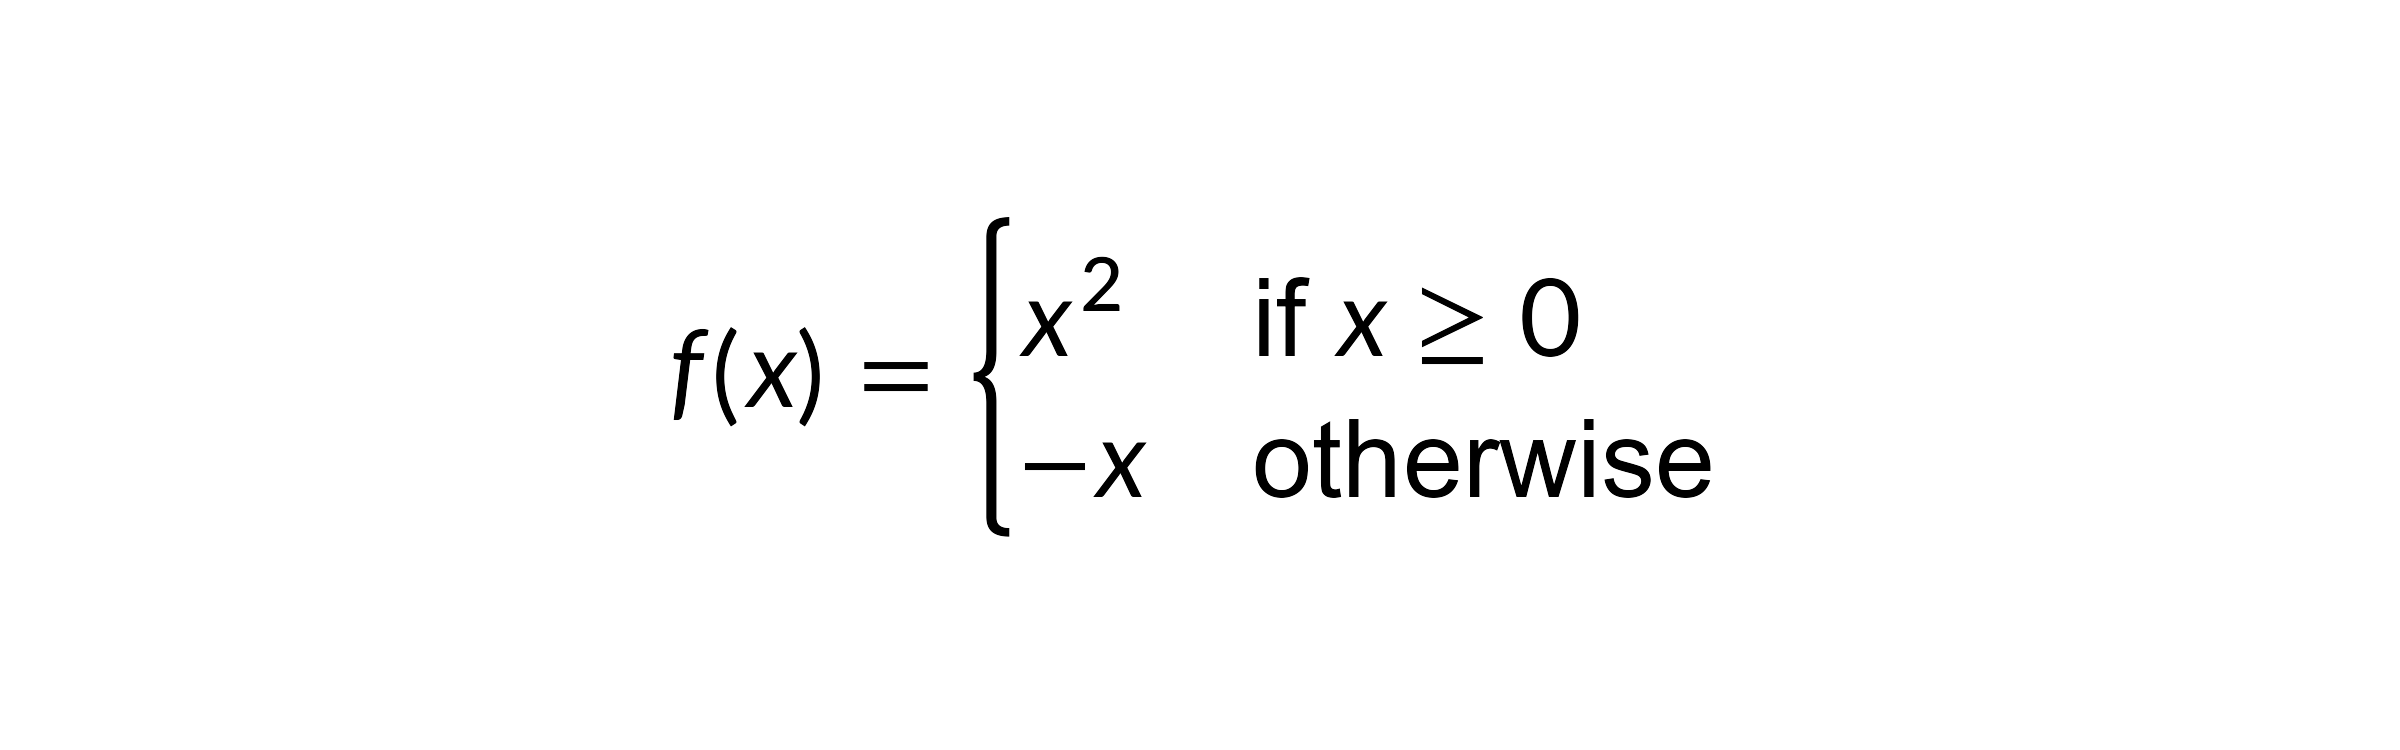
Mixed text and math
You can use r"()" raw strings to write LaTeX with regular newlines and quotes without escaping. Use \text{} to embed regular text within math expressions:
grid.newpage()
grid.latex(
  r"(f(x) = \begin{cases} x^2 & \text{if } x \geq 0 \\ -x & \text{otherwise} \end{cases})",
  gp = grid::gpar(fontsize = 26)
)
CJK and multilingual text
Non-math text via \text{} supports CJK and other scripts. Font settings from gp (fontfamily, fontface) apply to text only — math rendering always uses the selected math font:
grid.newpage()
grid.latex(r"(\text{如果 } x > 0 \text{ 则 } y = x^2)",
           gp = gpar(fontsize = 24, fontfamily = "sans"))
User-defined macros
Use define_macro() for zero-argument shorthands that persist across plots in the session, and plain-TeX \def for parameterised macros local to a single expression:
define_macro("RR", "\\mathbb{R}")
grid.newpage()
grid.latex(
  r"(\def\norm#1{\left\lVert #1 \right\rVert}
      \forall \vec{v} \in \RR^n,\ \norm{\vec{v}} \geq 0)",
  gp = grid::gpar(fontsize = 22)
)
See ?define_macro and vignette("getting-started") for details.
ggplot2 integration
Use geom_latex() to place LaTeX labels at data coordinates, and element_latex() for LaTeX-rendered axis titles:
library(ggplot2)
# Add a LaTeX table as an annotation
tab_str <- r"(\begin{tabular}{c|c} \text{A} & B^2 \\ \hline 1 & \cellcolor{#00bde5}2 \\ 3 & 4 \end{tabular})"

df <- data.frame(x = 1:3, y = 1:3,
                 eq = c("x^2", "\\frac{a}{b}", "\\sum_{i=1}^n x_i"))
ggplot(df, aes(x, y, label = eq)) +
  geom_latex() +
  annotate("latex", x = 1, y = 2.7, label = tab_str, size = 12) +
  labs(x = "$\\beta_1 \\cdot x + \\beta_0$") +
  theme(axis.title.x = element_latex())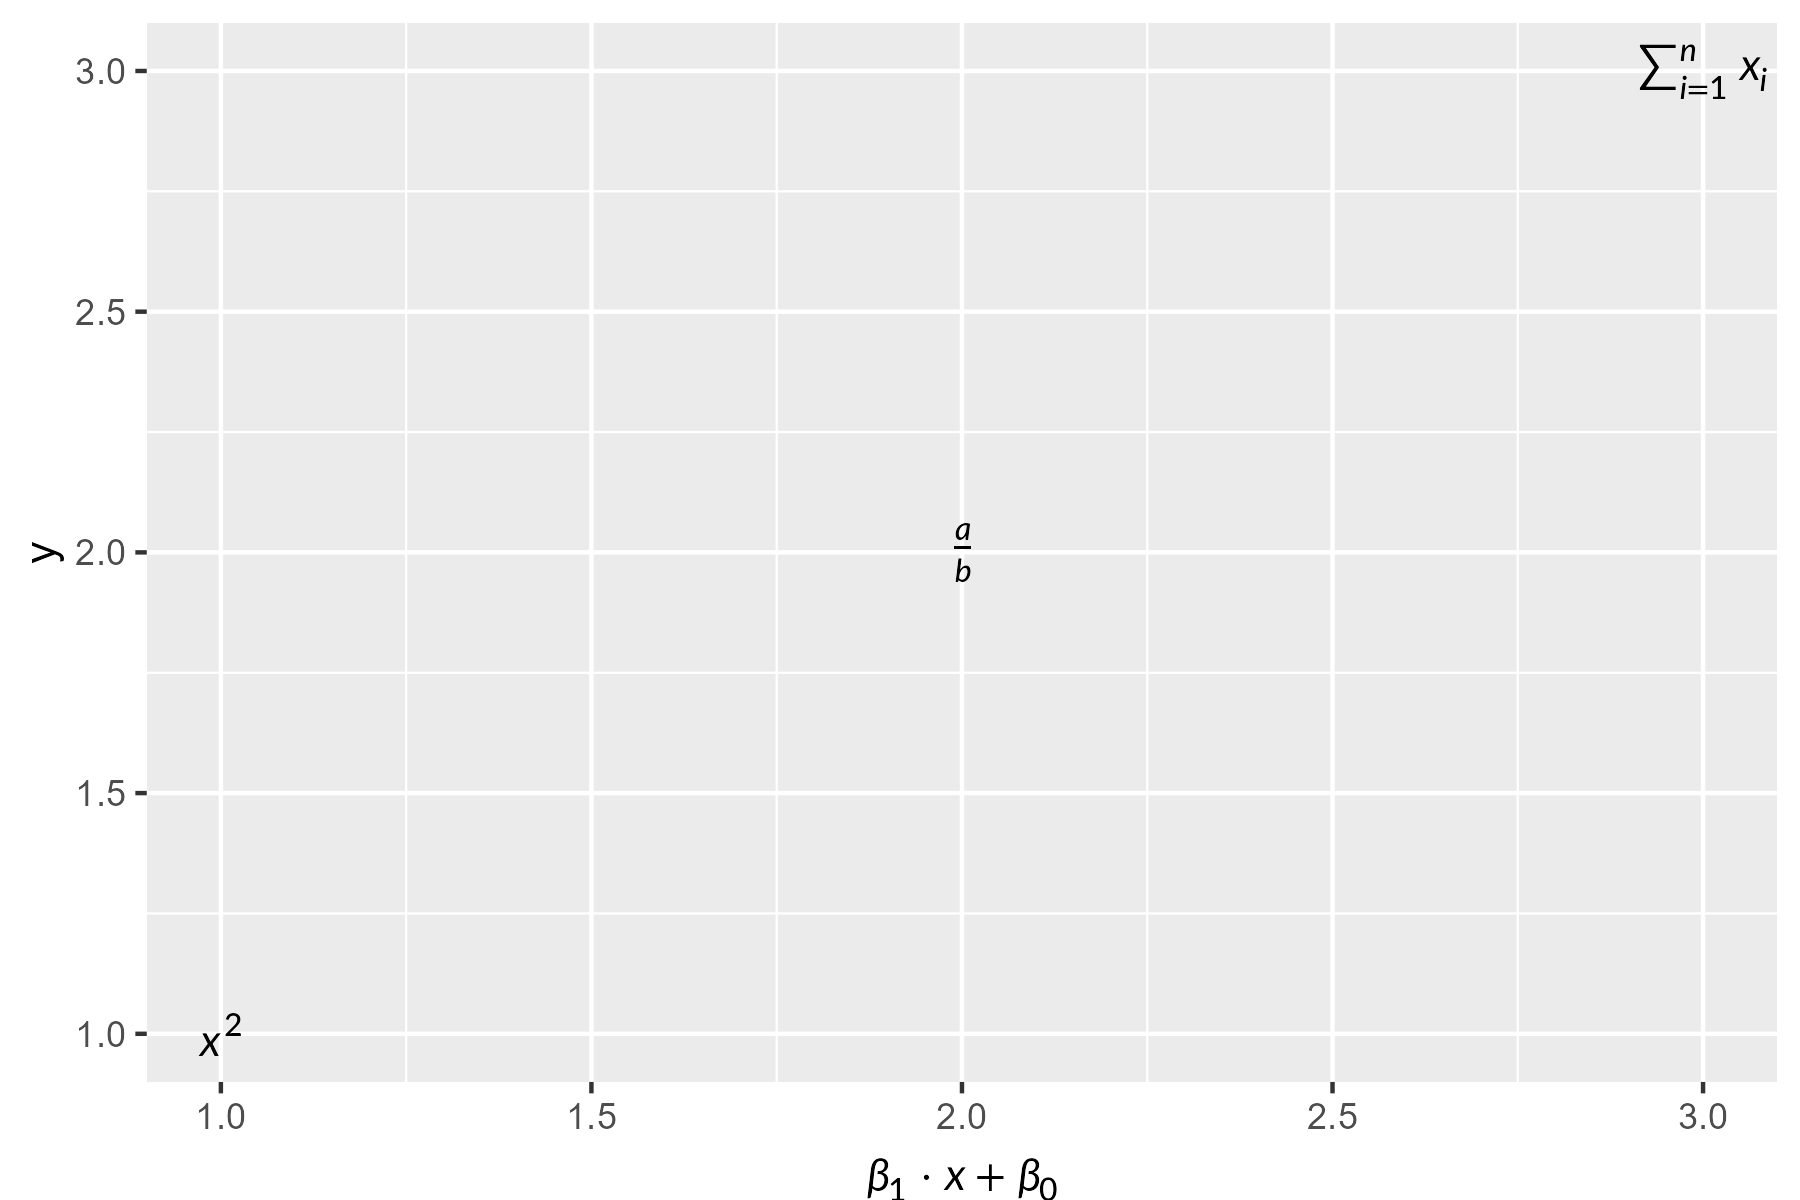
ggplot2 is a soft dependency — the core functions work without it. See vignette("ggplot2-integration") for more examples.
Comparison
| Approach | LaTeX required? | Device independent? | Vector? | Math coverage |
|---|---|---|---|---|
tikzDevice |
Yes | No | Yes | Full |
xdvir |
Yes | No | Yes | Full |
latexpdf |
Yes | No | Yes | Full (tables) |
latex2exp |
No | Yes | Yes | Limited |
plotmath |
No | Yes | Yes | Limited |
| gridmicrotex | No | Yes | Yes | Broad |
How it works
- Your LaTeX string is parsed by MicroTeX’s C++ engine into a TeX box model
- A custom
Graphics2Drecorder captures every draw operation (glyph paths, lines, rectangles) with exact coordinates - The layout crosses the C++/R boundary as a data frame
- R converts each record into native grid primitives (
pathGrob,segmentsGrob,rectGrob) - The result is a
gTreethat renders on any device at any resolution
By default, math glyphs are rendered in typeface mode as native text using the selected math font, which keeps PDF/SVG output selectable and searchable on devices with font embedding support.
When render_mode = "path" is used (or when automatic fallback is triggered on unsupported devices), glyphs are drawn as filled vector paths for consistent rendering everywhere.
Make sure to use ragg::agg_png(), svglite::svglite() or grDevices::cairo_pdf() for best results, as some older devices may not support the full range of path operations.
Graphics backend
The default graphics device on Windows (windows()) and macOS (quartz()) may not find the bundled math fonts, producing warnings like:
To avoid this, switch to a modern graphics backend that uses systemfonts for font resolution:
# For knitr / R Markdown — add to your setup chunk:
knitr::opts_chunk$set(dev = "ragg_png")

# For interactive use:
options(device = function(...) ragg::agg_png(tempfile(fileext = ".png"), ...))
Recommended backends:
| Backend | Format | Package |
|---|---|---|
ragg::agg_png() |
PNG | ragg |
svglite::svglite() |
SVG | svglite |
grDevices::cairo_pdf() |
Base R (Cairo build) |
Alternatively, use render_mode = "path" to bypass font lookup entirely — glyphs are drawn as vector paths, which works on all devices but produces non-selectable text in PDF/SVG.