Use this as a theme element for axis titles, axis labels, plot titles, or any other text element in a ggplot2 theme. The text string is parsed as LaTeX math and rendered via MicroTeX.
Arguments
- math_font
Name of the math font to use (e.g.,
"stix"). Use""(default) for Lete Sans Math, which pairs with R's default sans-serif text font. Seeavailable_math_fontsfor loaded fonts.- fontsize
Convenience alias for
size; when supplied, it is forwarded toggplot2::element_text()as the text size in points. IfNULL(default), the theme's inherited size is used.- lineheight
Multi-line height multiplier (default 1.2), matching
grid::gpar()semantics.- max_width
Numeric maximum width in big points for automatic line wrapping. Use
0(default) for no wrapping.- input_mode
How
texis interpreted before being parsed."mixed"(default) wraps the input in\text{...}so the string reads as ordinary text and$...$(or\(...\)) opens math mode, matching document-level LaTeX semantics. Useful for labels that arrive from external sources mixing prose and math without explicit\text{}markers."math"is the classic MicroTeX behaviour — the whole string is treated as math, so unwrapped prose renders as spaced math italics. The default can be changed globally vialatex_options(input_mode = "math"). Seelatex_wrapfor details on the wrapping process.- render_mode
Character string:
"typeface"(default) renders glyphs as native text using the math font, producing selectable/accessible text in PDF and SVG output. Bundled math fonts and any registered viaload_fontare read directly from their OTF files — no system-wide font install is required. Falls back to path mode automatically on devices that lack the R \(\geq\) 4.3 glyph engine (e.g., the basepdf()device). For selectable PDF output, prefercairo_pdf."path"renders math symbols as filled vector paths (works on all devices but text is not selectable in PDF/SVG).- ...
Additional arguments passed to
ggplot2::element_text()(e.g.,size,colour,hjust).
Value
An S7 object of class element_latex, inheriting from
ggplot2::element_text.
Details
Dollar signs ($...$) in the label text are stripped automatically
so that both "\frac{a}{b}" and "$\frac{a}{b}$" work.
This element is an S7 subclass of ggplot2::element_text, so it
inherits all standard text properties (size, colour, hjust, etc.) from
the theme and supports merge_element() correctly.
Examples
# \donttest{
if (requireNamespace("ggplot2", quietly = TRUE)) {
library(ggplot2)
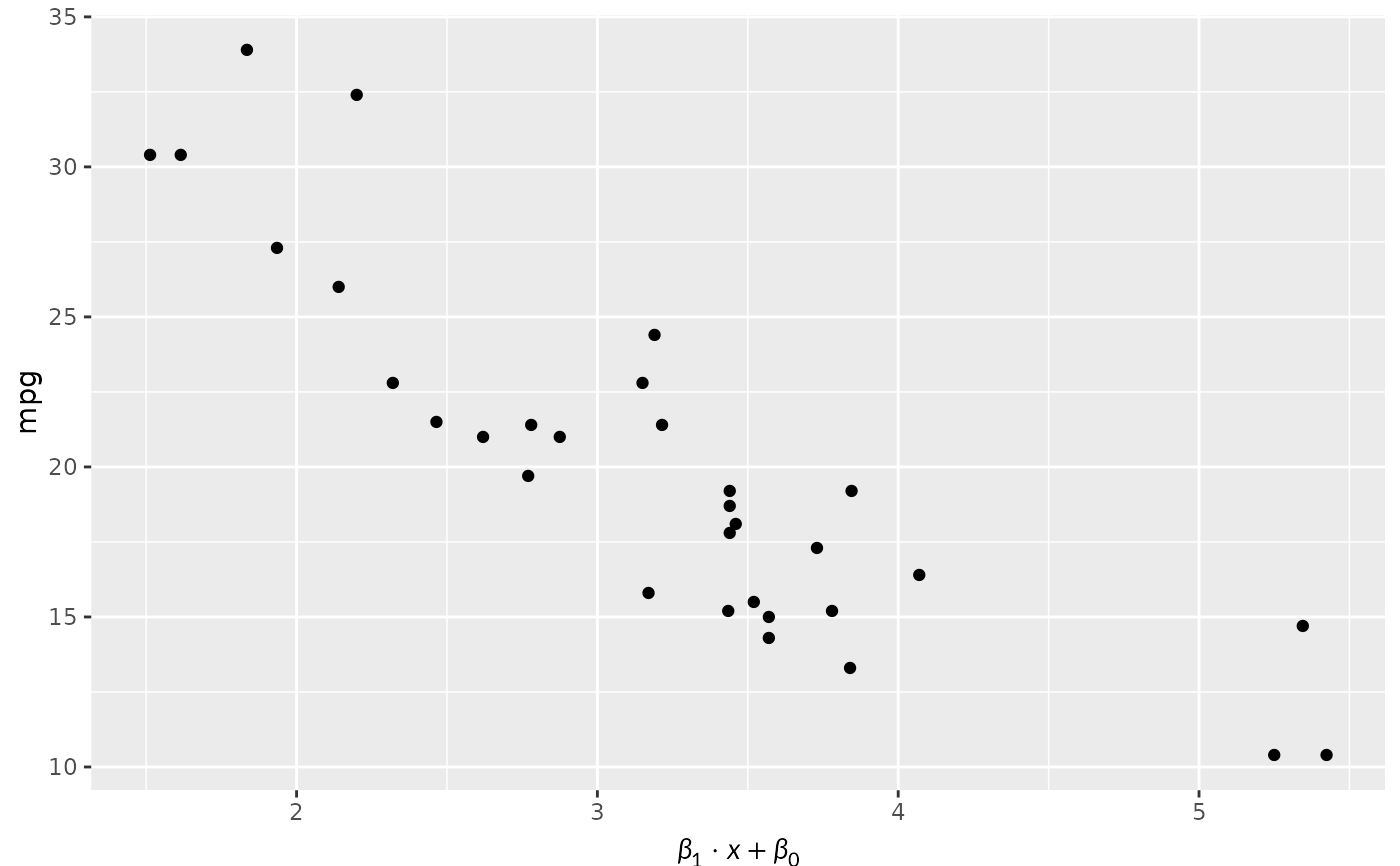
ggplot(mtcars, aes(wt, mpg)) + geom_point() +
labs(x = "$\\beta_1 \\cdot x + \\beta_0$") +
theme(axis.title.x = element_latex())
}
 # }
# }