Change the look of a forest plot. The settings given in ... update
the current style of the plot: settings left out keep their current value,
a gpar is merged into the current one and NULL
goes back to the default. Like set_labs, this builds the plot
again, so it must be used before the plot is edited with
edit_plot and the other editing functions.
Arguments
- plot
A forest plot object, see
forest.- style
A style created with
forest_style, or a theme created withforest_theme, that replaces the current style of the plot. The settings in...are applied on top of it.forest_style()gives the default style.- ...
Arguments of
forest_styleto change, for exampletitle = gpar(col = "red"),fit = "width"orcore = list(...).
Examples
library(grid)
# Read provided sample example data
dt <- read.csv(system.file("extdata", "example_data.csv", package = "forestploter"))
dt <- dt[1:6, ]
# Add a blank column for the forest plot to display CI
dt$` ` <- paste(rep(" ", 20), collapse = " ")
p <- forest(dt[, c("Subgroup", " ")],
est = dt$est,
lower = dt$low,
upper = dt$hi,
ci_column = 2,
ref_line = 1,
style = forest_style(base_size = 10, ref_line = gpar(col = "red")))
# Settings left out are kept, so the reference line stays red
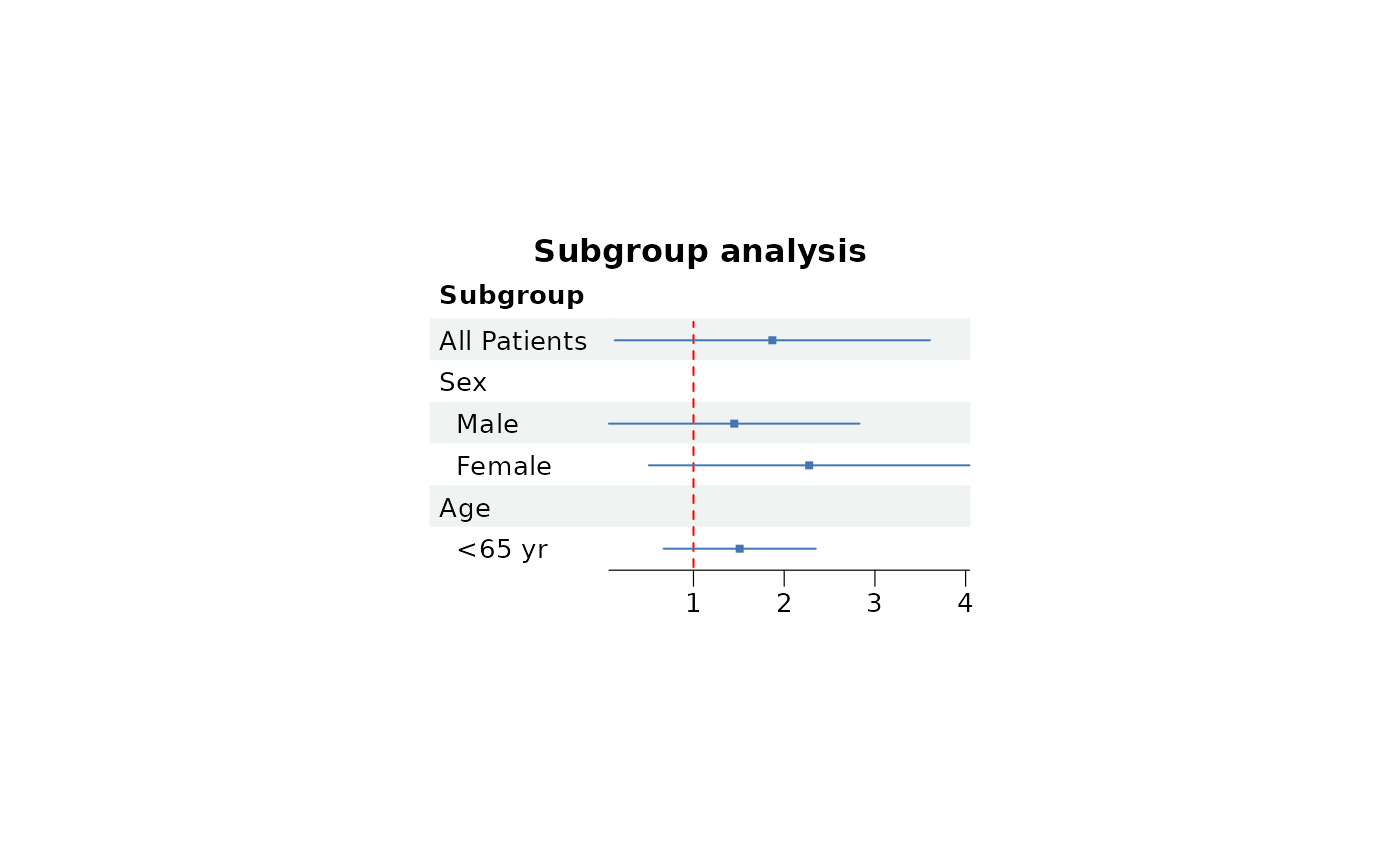
p <- set_style(p, ci = gpar(col = "#4575b4"), title_just = "center")
plot(set_labs(p, title = "Subgroup analysis"))
 # `NULL` goes back to the default, a style replaces the whole style
plot(set_style(p, ref_line = NULL))
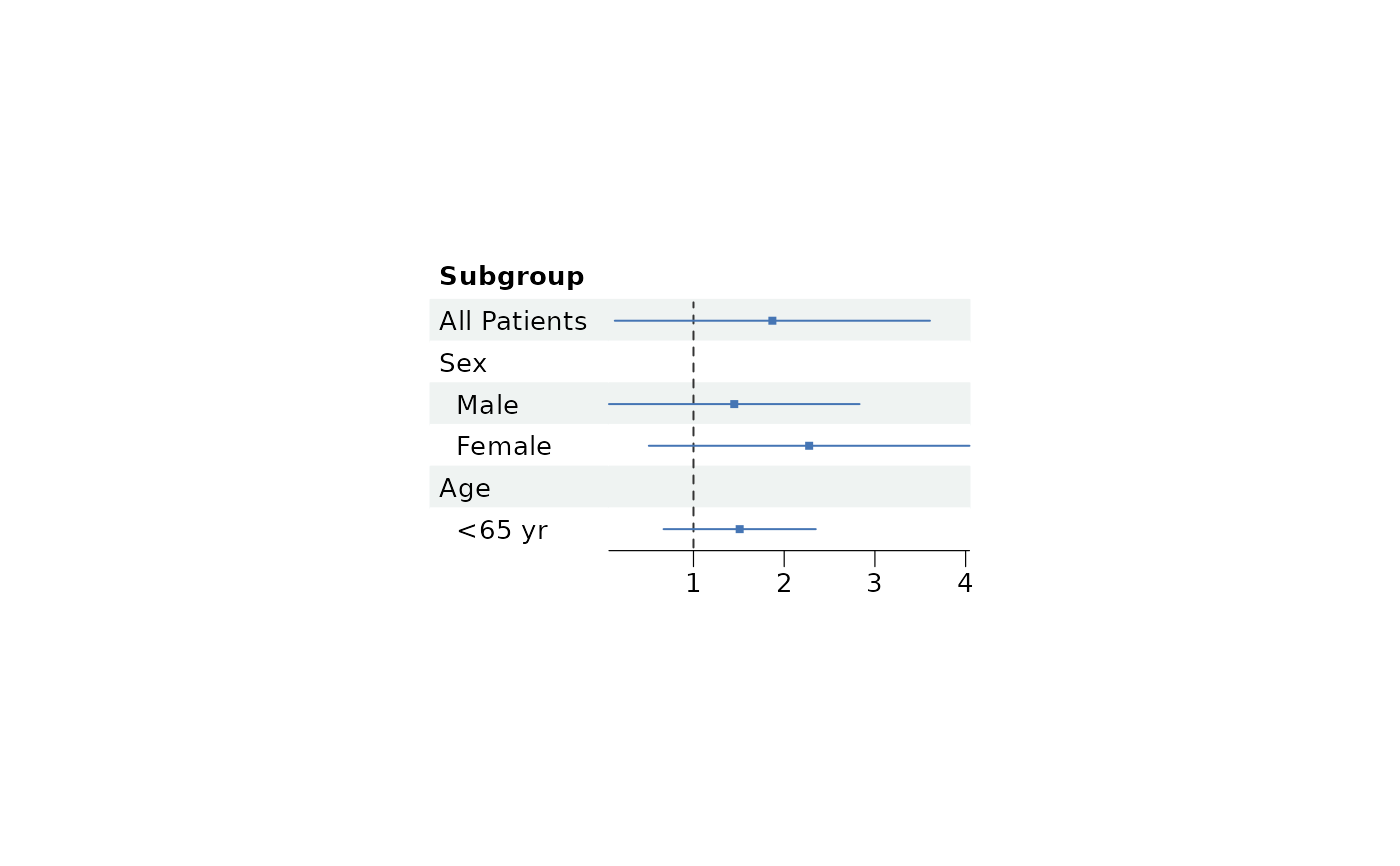
# `NULL` goes back to the default, a style replaces the whole style
plot(set_style(p, ref_line = NULL))
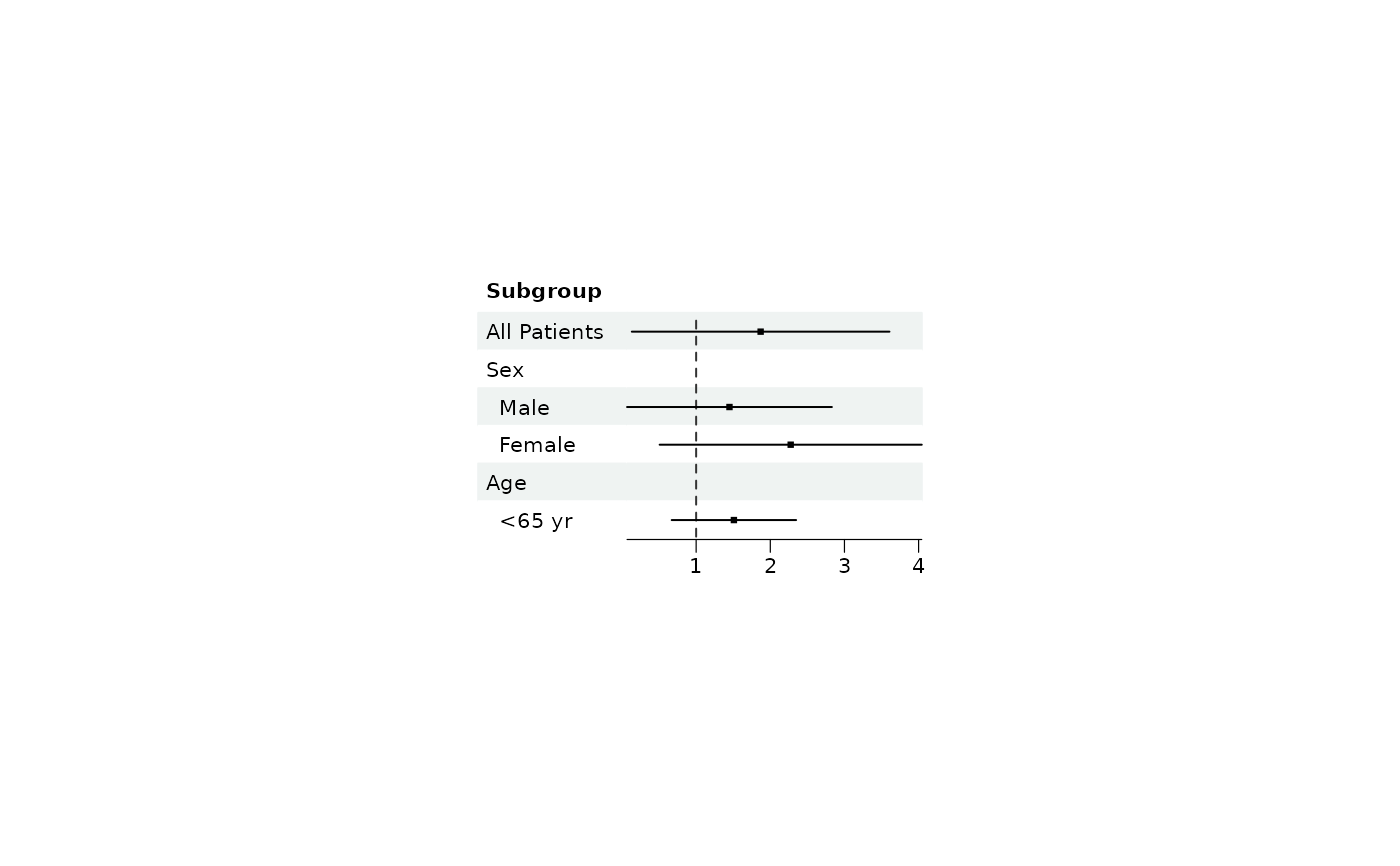
 plot(set_style(p, forest_style(base_size = 8)))
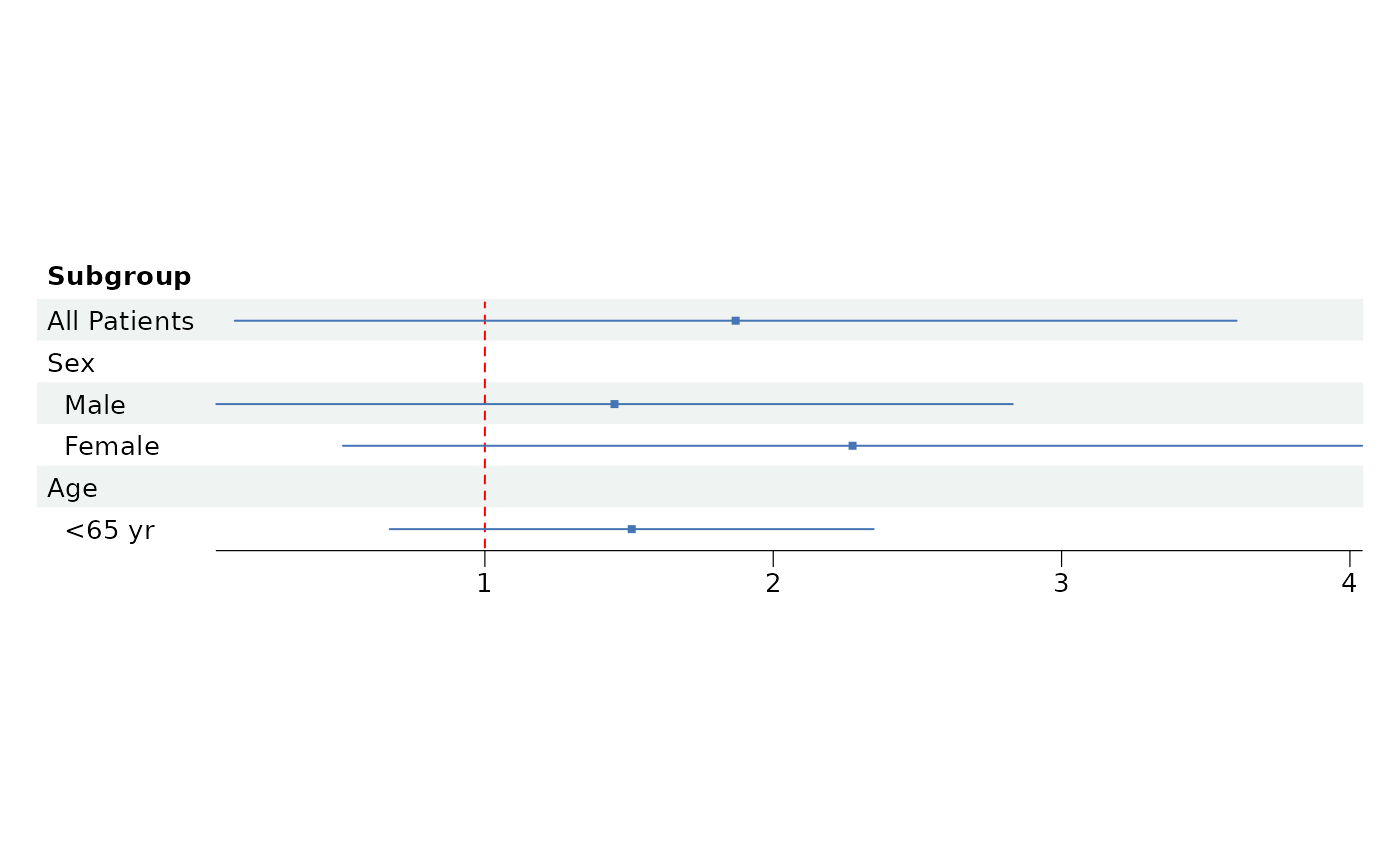
 # Let the CI column take the width of the page it is drawn on
plot(set_style(p, fit = "width"))
# Let the CI column take the width of the page it is drawn on
plot(set_style(p, fit = "width"))